Urban Sound Diary
Browser-based Interactive Urban Sound Explorer App
2024.7--2025.3
Project Members
Fu Xuehua
Liu Zhaorui
Wen Jiayi
Zheng Hao
Dong Bo
Marcel Zaes Sagesser
MY ROLE
UI Designer
Sound Interaction Designer
Frontend Developer
TOOLS
Python
Flask
JavaScript
(Web Audio API)
SURPPOTED BY
Sound Studies Group
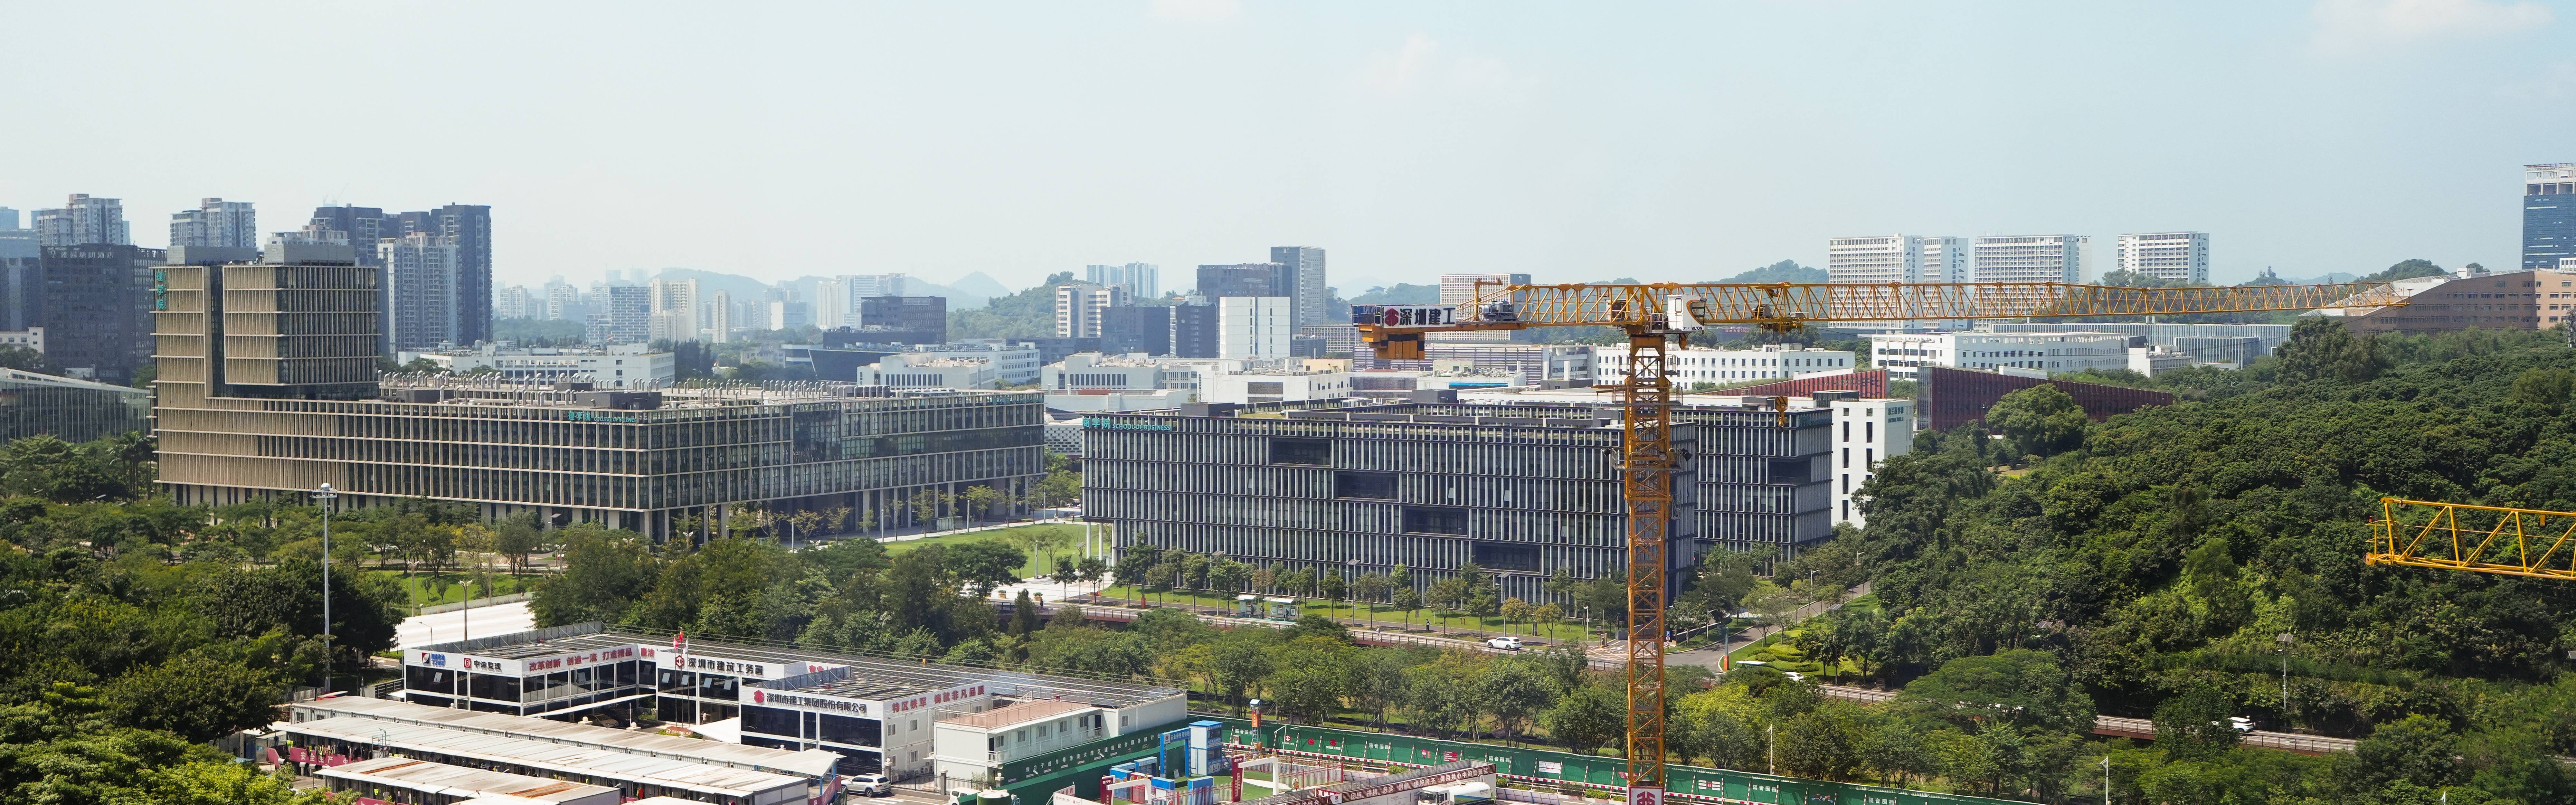
How do people interact with their cities through sonic technologies, and how do such technologies, in turn, change our cities? On the example of Shenzhen, a large Chinese city with a high sonic density, this research aims at understanding, through a designed technological sound interaction device, the "messiness" and loudness of the city famous for its "high-tech" pioneers. Sonic technologies are a constitutional element of our contemporary urban soundscapes, which, in turn, are increasingly overtly complex assemblages. Using an interdisciplinary framework with sound studies, data visualization, computer science and auditory interaction design, the authors have developed "Urban Sound Diary", a browser-based app which allows local users to record, visualize, and creatively re-play the sounds from their urban environment. This paper details the conceptual approach as well as the technical development of "Urban Sound Diary", including the application of concatenative synthesis, auditory feature extraction and dimensionality reduction for a 2D data plot on the user interface, as well as creating the sound "remixer" for users to interact with. We report the findings from the pilot user study that includes outdoor test recordings for dataset building and indoor playback and remixing. The discussion builds on the authors' interdisciplinary backgrounds and previous work in computer science, computer music, sound cognition, and sound studies, so as to shed light on a novel, practice-based approach to interacting with the sonic city. The feature space of urban sounds in a highly complex environment, such as Shenzhen, is "compressed" in "Urban Sound Diary". This approach has the potential to reveal new knowledge about how users interact with their urban environments through sound technology; and how the latter ultimately shapes the city.
We present the design of "Urban Sound Diary" (see figure 5), a browsed-based mobile app for users in Shenzhen to record their sonic footprints, explore the collection of urban sounds contributed by other users, and create an imaginary soundscape of their own, on their phone. The app consists of a recorder module and a sound browser module. The recorder allows the user to record sounds and upload audio files to the server. The recorder page contains a standard waveform visualizer that provides real-time feedback while the user records. A duration of 5 to 60 seconds is recommended by the app. By engaging users in playing with our app, a database of urban sounds is constructed collectively from user uploads, using a participatory, crowd-sourcing approach.
Workflow of "Urban Sound Diary", starting with the existing and changing soundscape of a dense urban space like Shenzhen, the user recording the former with the provided app and the phone's built-in microphone, the uploading process to the server, and the sound browser offering the user a visualized, interactive UI to re-enliven and play with the collected sounds.
Sound Recorder
The recorder allows users to record, play back, and upload audio for analysis. When the record button is pressed, it turns orange and initiates audio recording via the MediaRecorder API, visualizing the waveform on a canvas. The visual utilizes 'getUserMedia' to access the microphone, initializes an 'AudioContext' and an 'AnalyserNode' for real-time processing, and draws the waveform with the canvas 2D context. Users can manage recordings through various buttons, with recorded audio saved as a Blob for playback and uploading. A timer is displayed during recording, and upon completion, a recording list appears showing the recording time, options to delete or upload recordings, and playback functionality. Once users upload the recording, the segmentation of the audio will begin. After uploading, audio segmentation begins, and once the user completes recording and playback, the analyzer button integrates the segmented audio using t-SNE and UMAP algorithms, directing the user to the sound browser page.
Data visualization
The app provides the user with an intuitive visual interface of the crowd-sourced database to navigate the segmented sound units in a 2D space, to experiment with post-effects on the selected sounds, and to combine samples into artistic-creative digital soundscape compositions that act as their urban sound diary. The app is aimed at making ordinary users aware of their sonic surroundings and of their city; and it assists them in understanding their sonic environment as an essential part of their experience in urban space. The app also explores an experimental tool for soundscape design leveraging interactive data visualization and sonic creation.
Concatenative sound synthesis (CSS) is a technique for synthesizing a target sound by assembling matching samples from a sound database. It has inspired the design of data-driven music systems and interfaces for synthesis, composition, performance, and other experimental purposes. The conventional workflow of a CSS system involves 1. temporal segmentation: segmenting source sounds from the database into shorter sound units; 2. feature extraction: extracting descriptors of the units; 3. unit selection: selecting sound units to assemble a target phrase according to a proximity measure in the descriptor space. The feature extraction phase results in very long feature vectors for all sound units, and a corresponding highdimensional feature space.
From here, CSS creates an explorable space of the sound data-slide-to, which can be mapped into a 2-dimensional space by applying dimensionality reduction methods such as Principal Component Analysis (PCA), Self-Organizing Maps (SOM), t-distributed Stochastic Neighbor Embedding (t-SNE), and Uniform Manifold Approximation and Projection (UMAP). By connecting an interactive scatterplot visualization of the 2-dimensional space, the user is provided with an intuitive visual interface to explore the sound database, allowing them to navigate the scatterplot and select sound units to play and listen to.
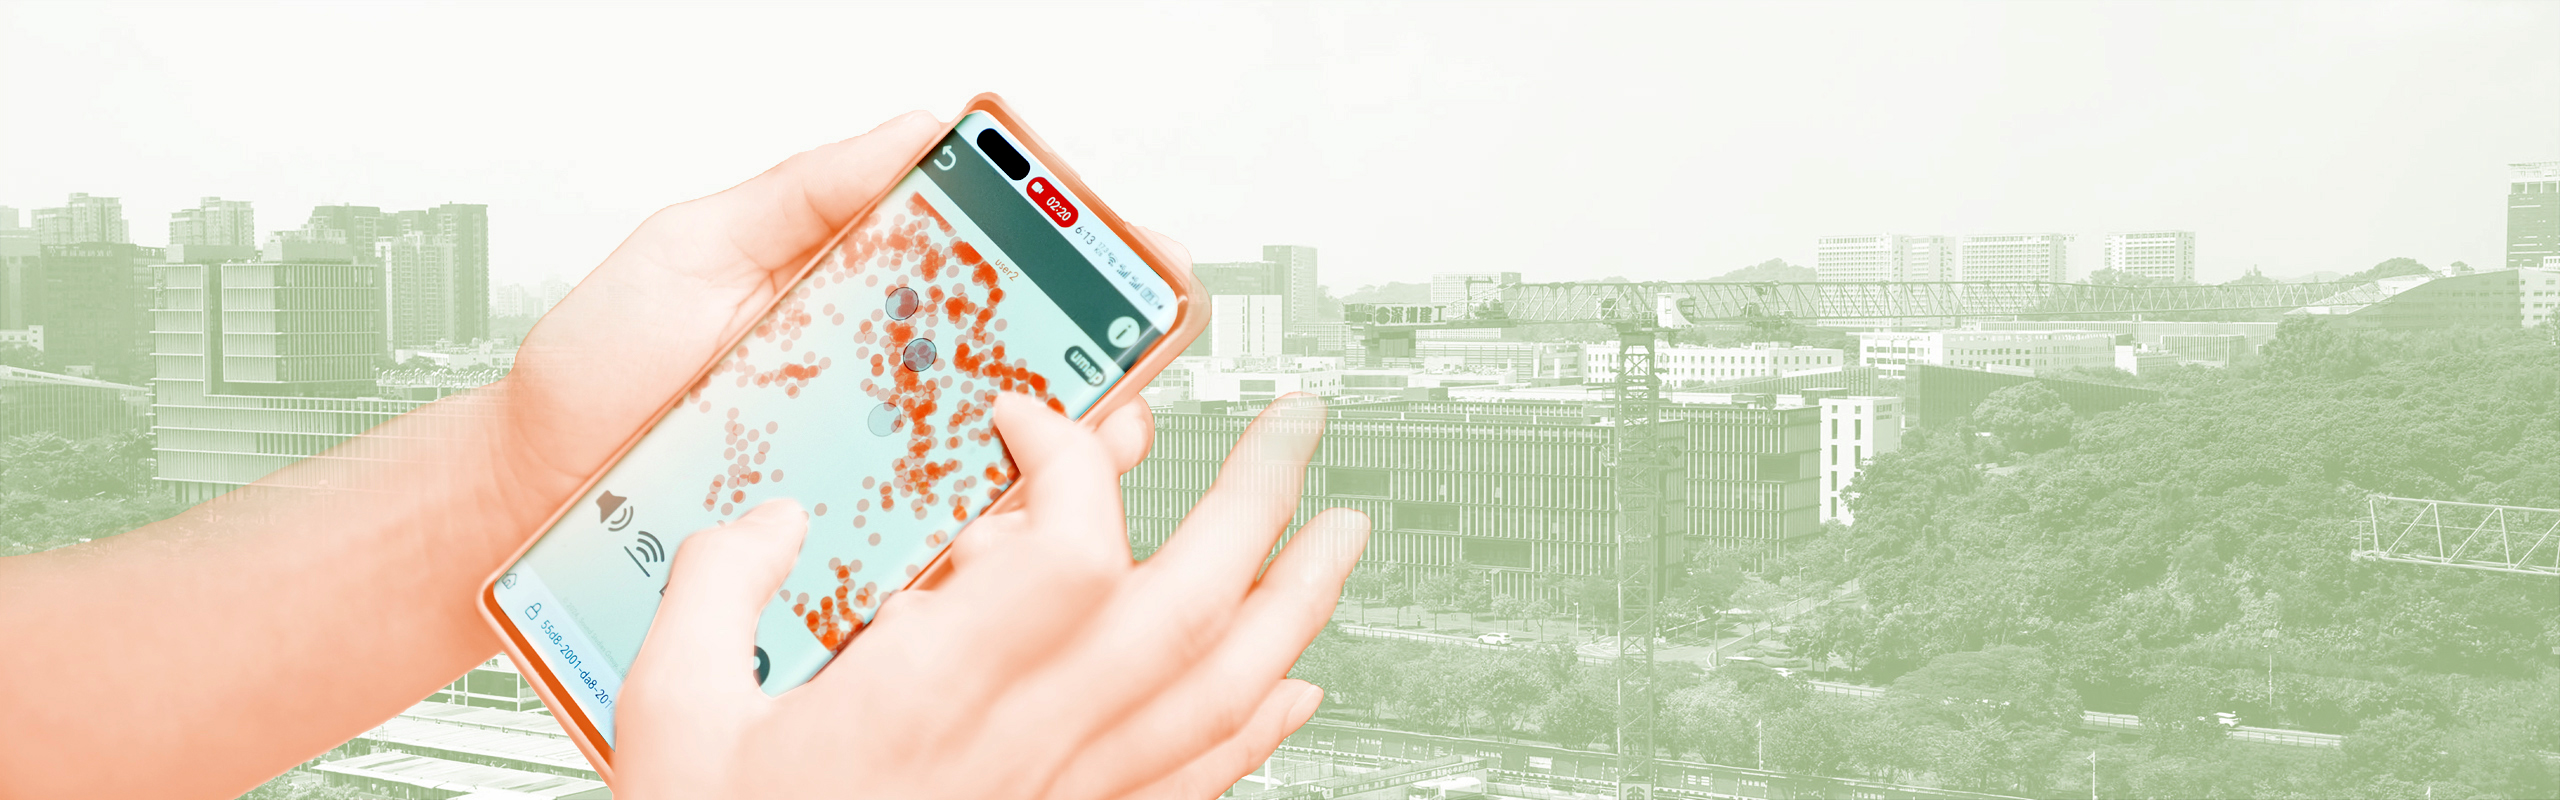
Interaction Interface
The primary objective of Interaction Interface is to create an interactive scatterplot visualization that integrates dynamic audio playback, enabling users to explore spatial data points through auditory interaction while engaging with corresponding sound files. To further enhance user engagement and playability, the ability to switch between UMAP and t-SNE was implemented. Users can toggle between the two algorithms in the top right corner to compare different visualizations and playback experiences directly. The scatterplot, rendered within a dynamically sized SVG using D3.js, allows users to zoom and pan across a coordinate plane where each data point represents a sound file.
The key feature of the interface is the integration of the Web Audio API for dynamic audio playback. Upon user interaction with the scatterplot (e.g., clicking or hovering over a point), and the corresponding audio file associated with that data point is played back. This is achieved by preloading audio elements tied to each data point, which are connected to the audio processing graph consisting of nodes such as GainNode, FilterNode, volumnNode and ConvolverNode. These nodes are responsible for real-time manipulation of sound parameters such as reverb and the low-pass filter's cutoff frequency.
The "selection circle" mechanism is implemented to enable group interactions. When the user clicks on a location within the scatterplot, a circle is dynamically generated at the position of interaction, identifying and clustering nearby data points. The circle identifies points within its area by calculating the distance between the click location and each point's coordinates. Audio playback is triggered sequentially for the points within the selection, using a randomized order to enhance the auditory experience linked to the spatial arrangement of the data. The d3.shuffle function is used to randomize the order, and each audio file is played with custom start and end times, using setTimeout to pause the audio after its duration is completed.
Consequently, audio preloading and data binding are handled via D3's csv() function, which loads the data points from the CSV file. For each data point, an 'audio' HTML element is created, and its source is linked to the user's recording file corresponding to that point's metadata. The audio files are connected to the Web Audio API's audio graph, ensuring that they respond to user interactions on the scatterplot. The function scatterplot-visualize binds the data to visual elements (the dots) and assigns event listeners to trigger audio playback upon interaction.
To interact with the visualization, tools for control over audio effects are further enhanced through sliders, allowing users to adjust reverb, volume, and filter cutoff frequency for the low-pass filter in real time. This functionality enables users to manipulate the auditory composition made out of the data, creating a dynamic, user-driven exploration of sound, with auditory interaction, within a visualized space. Simultaneously, the eraser icon enables users to delete selected sound units (dots on the visualization) in the eraser mode, increasing the user's agency and the app's playability, while the crowd icon allows toggling the scatterplots to display either all users' sounds or only the individual user's own recordings.
Sound Map (New Version 2025.3.14)
The purpose of this study is to enhance the participation and user experience of urban sound research, and promote the development of mobile based urban sound collection and interaction technology. Through users' sound recordings and subjective descriptions in different urban environments, such as urban parks and technology parks, this study can provide profound insights into how urban soundscapes affect people's perception and experience.
Chinese CHI 2024 Workshop (2024.11.22)
This workshop seeks to engage participants in exploring and manipulating urban sound data utilizing the Urban Sound Diary application.