Inside & Outside
Sonic Interaction and Risk Perception Through Sound in the Example of Shenzhen City
2024.7--2025.6
Project Members
Xiang Qiuya
Liu Zhaorui
Marcel Zaes Sagesser
Huang Yu
Chen Jiayi
Jin Yixuan
MY ROLE
Data Collection
Sound Processing
Experiment Design
Driver
TOOLS
PsychoPy
Python
Device:
Ambisonic Microphone(RØDE NT-SF1)
Decibel Meter
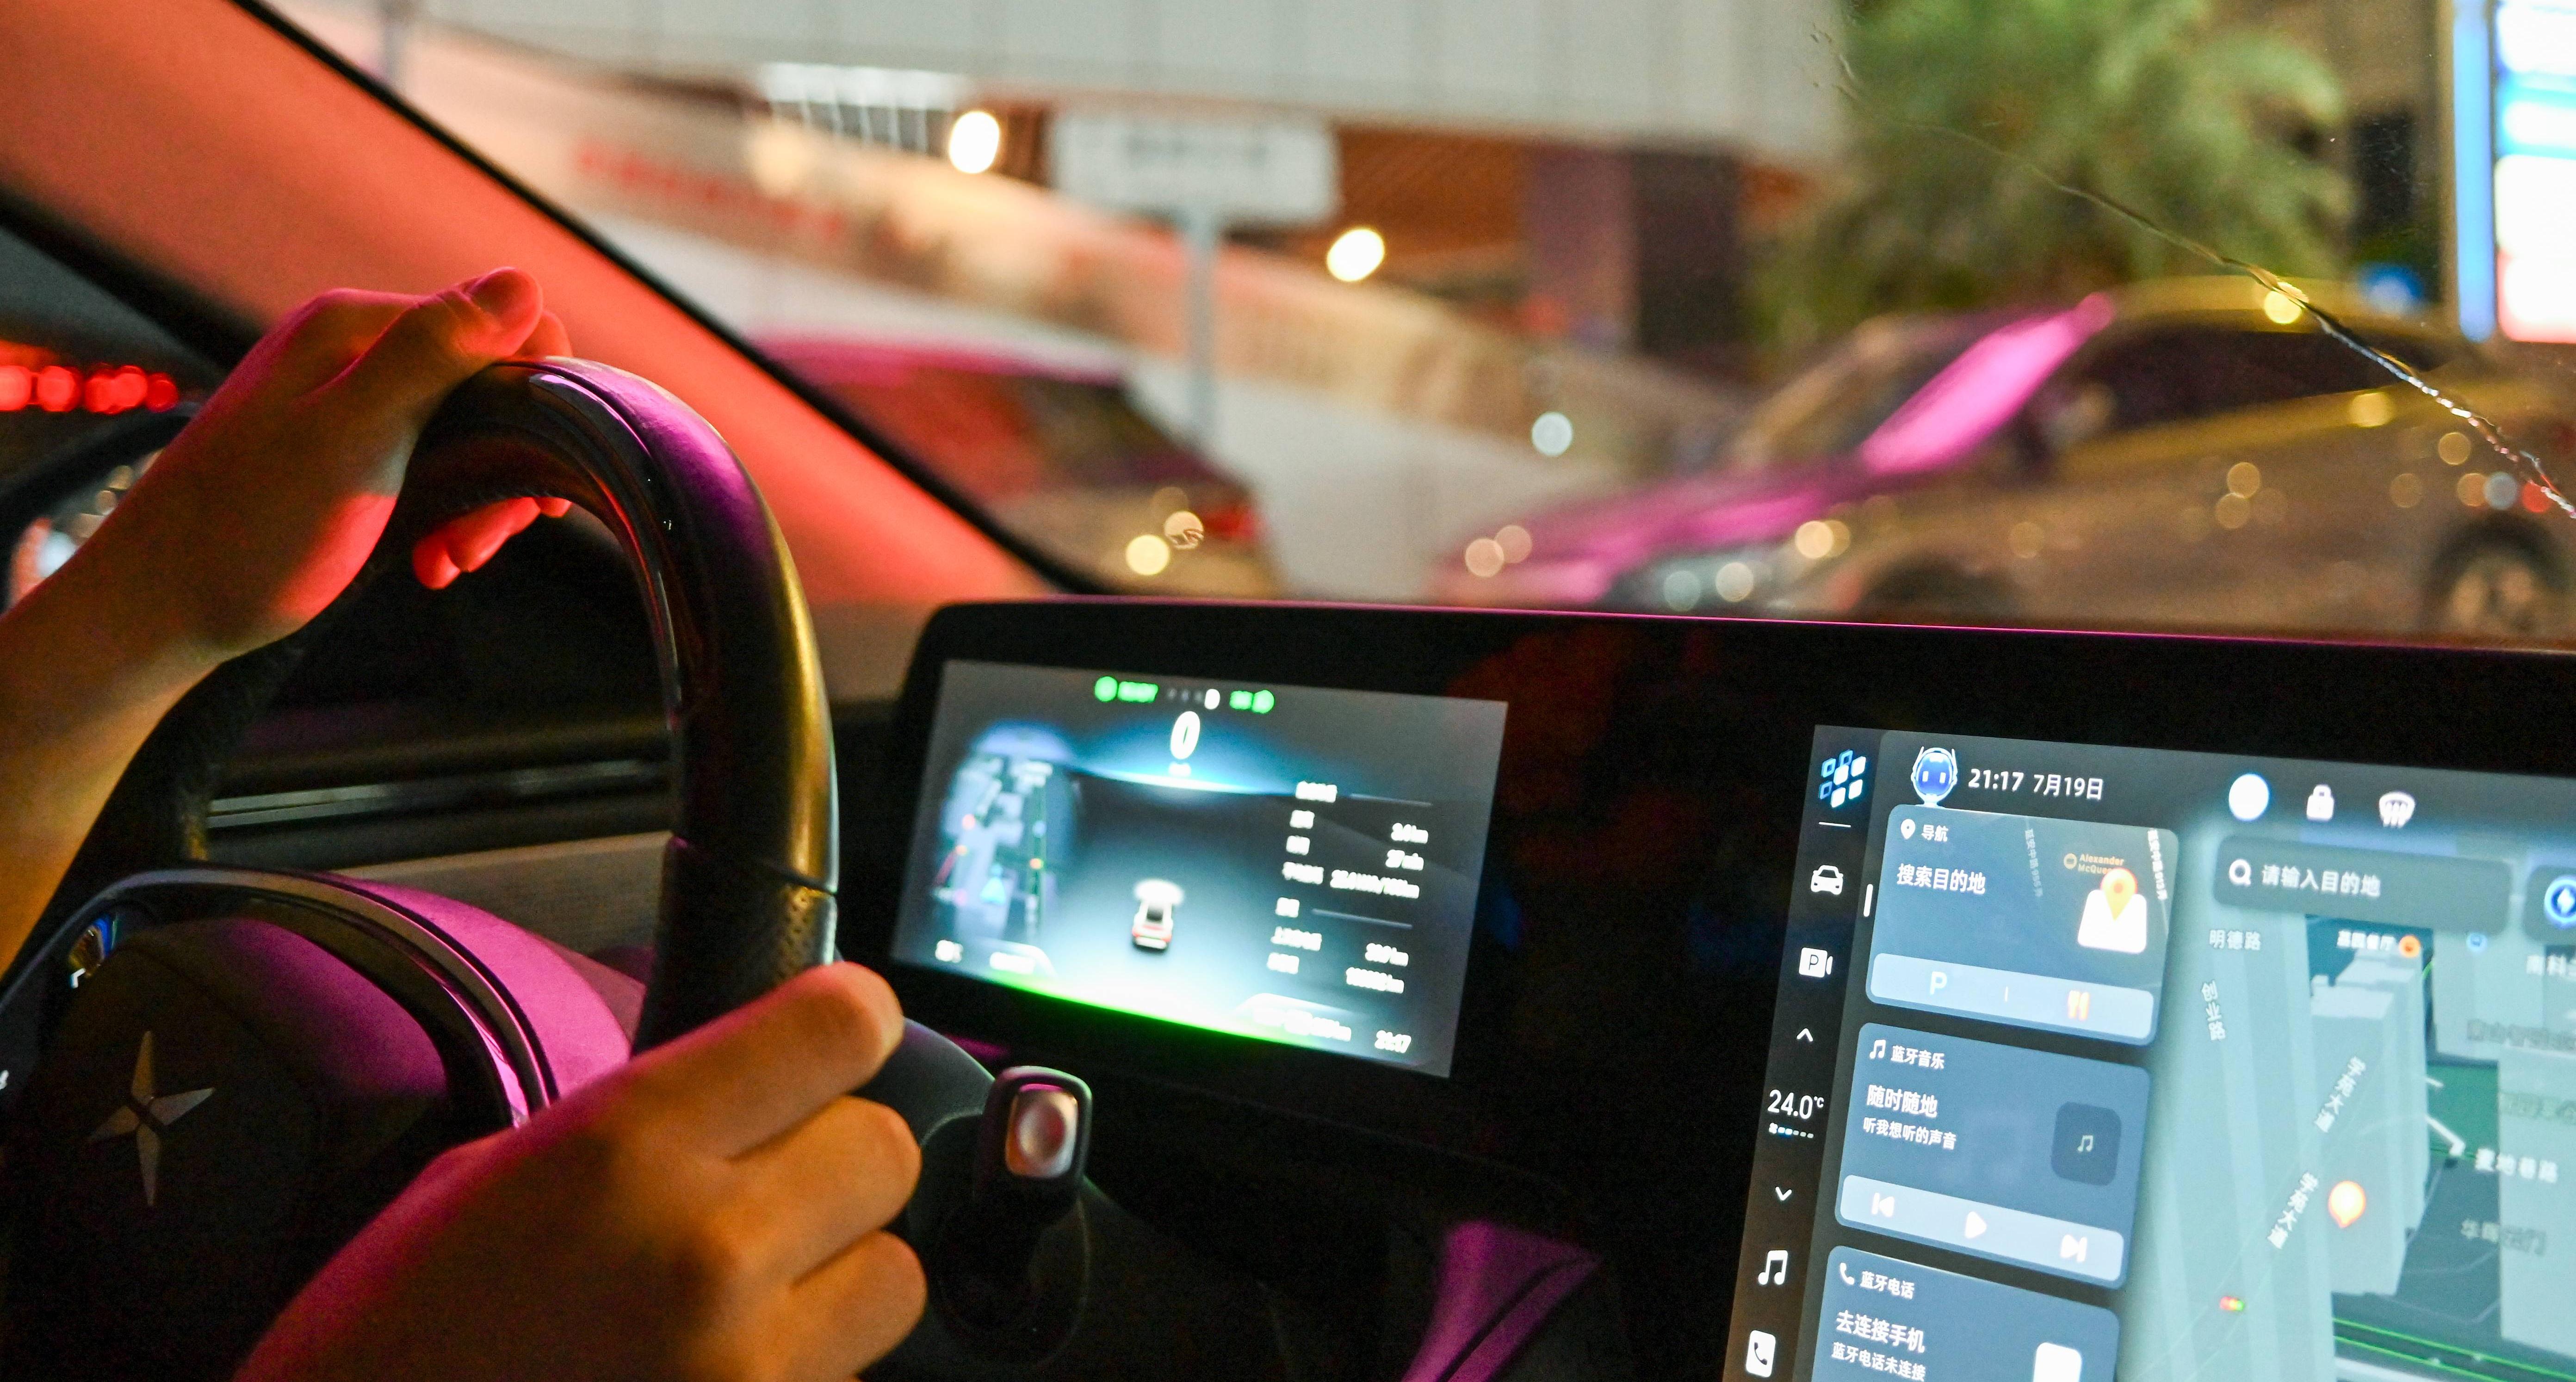
XPeng P7
SURPPOTED BY
Sound Studies Group
Due to the low noise of electric vehicles and safety considerations, companies have designed specialized alarm sounds to alert pedestrians to safety risks. As one of the road users, car drivers are also affected by sound. However, the complexity of soundscape in urban street poses a challenge to the effectiveness of sound. This research explores the impact of the sound emitted by electric vehicles - from inside and from outside of the vehicle - as perceived by pedestrians and drivers in Shenzhen. The study measures the perceived risk caused by electric vehicles in different urban streets of the city. The project primarily investigates the socalled "electric vehicle warning sounds" or "Acoustic Vehicle Warning System (AVAS)" that is integrated into vehicles in terms of audibility, comfort, concentration, controllability, and sense of risk.
This project evaluates the higher risk perception from outside than inside the car. The alerting sound in underground parking lot means higher danger to the driver, while to pedestrian is the intersection. Also the increasing audibility will raise the driver's risk perception but decrease pedestrian's. The research results will give out specific street soundscape for future exploring. It also provides new suggestions for the design of AVAS sound for electric vehicles, and contributes to theoretical exploration and design practice in fields such as urban soundscape, industrial sound design, and psychoacoustics.
Study Area
We conducted fieldwork to gather audio and visual data from five distinct types of urban streets, including park, intersection, underground parking lot, food street, and residential road.
Data Collection
Inside
Use RØDE NT-SF1 Ambisonic Microphone to record spatial audio inside the car, ZOOM H6 recorder to record Stereo audio, and SMARTSENSOR AR844 Decibel Meter to measure the decibel level of the environment. The RØDE NT-SF1 is held by Passenger 3 in the back seat of the car and placed in the middle position between the Driver and Passenger 1, and connected to the Mixer(PreMix-6 II) using wires, record the Ambix format and Fuma format at the same time; The ZOOM H6 recorder is held by Passenger 2 in the back seat of the car and placed near Driver's ear; The Decibel Meter is held by Passenger 1 in the front seat of the car.
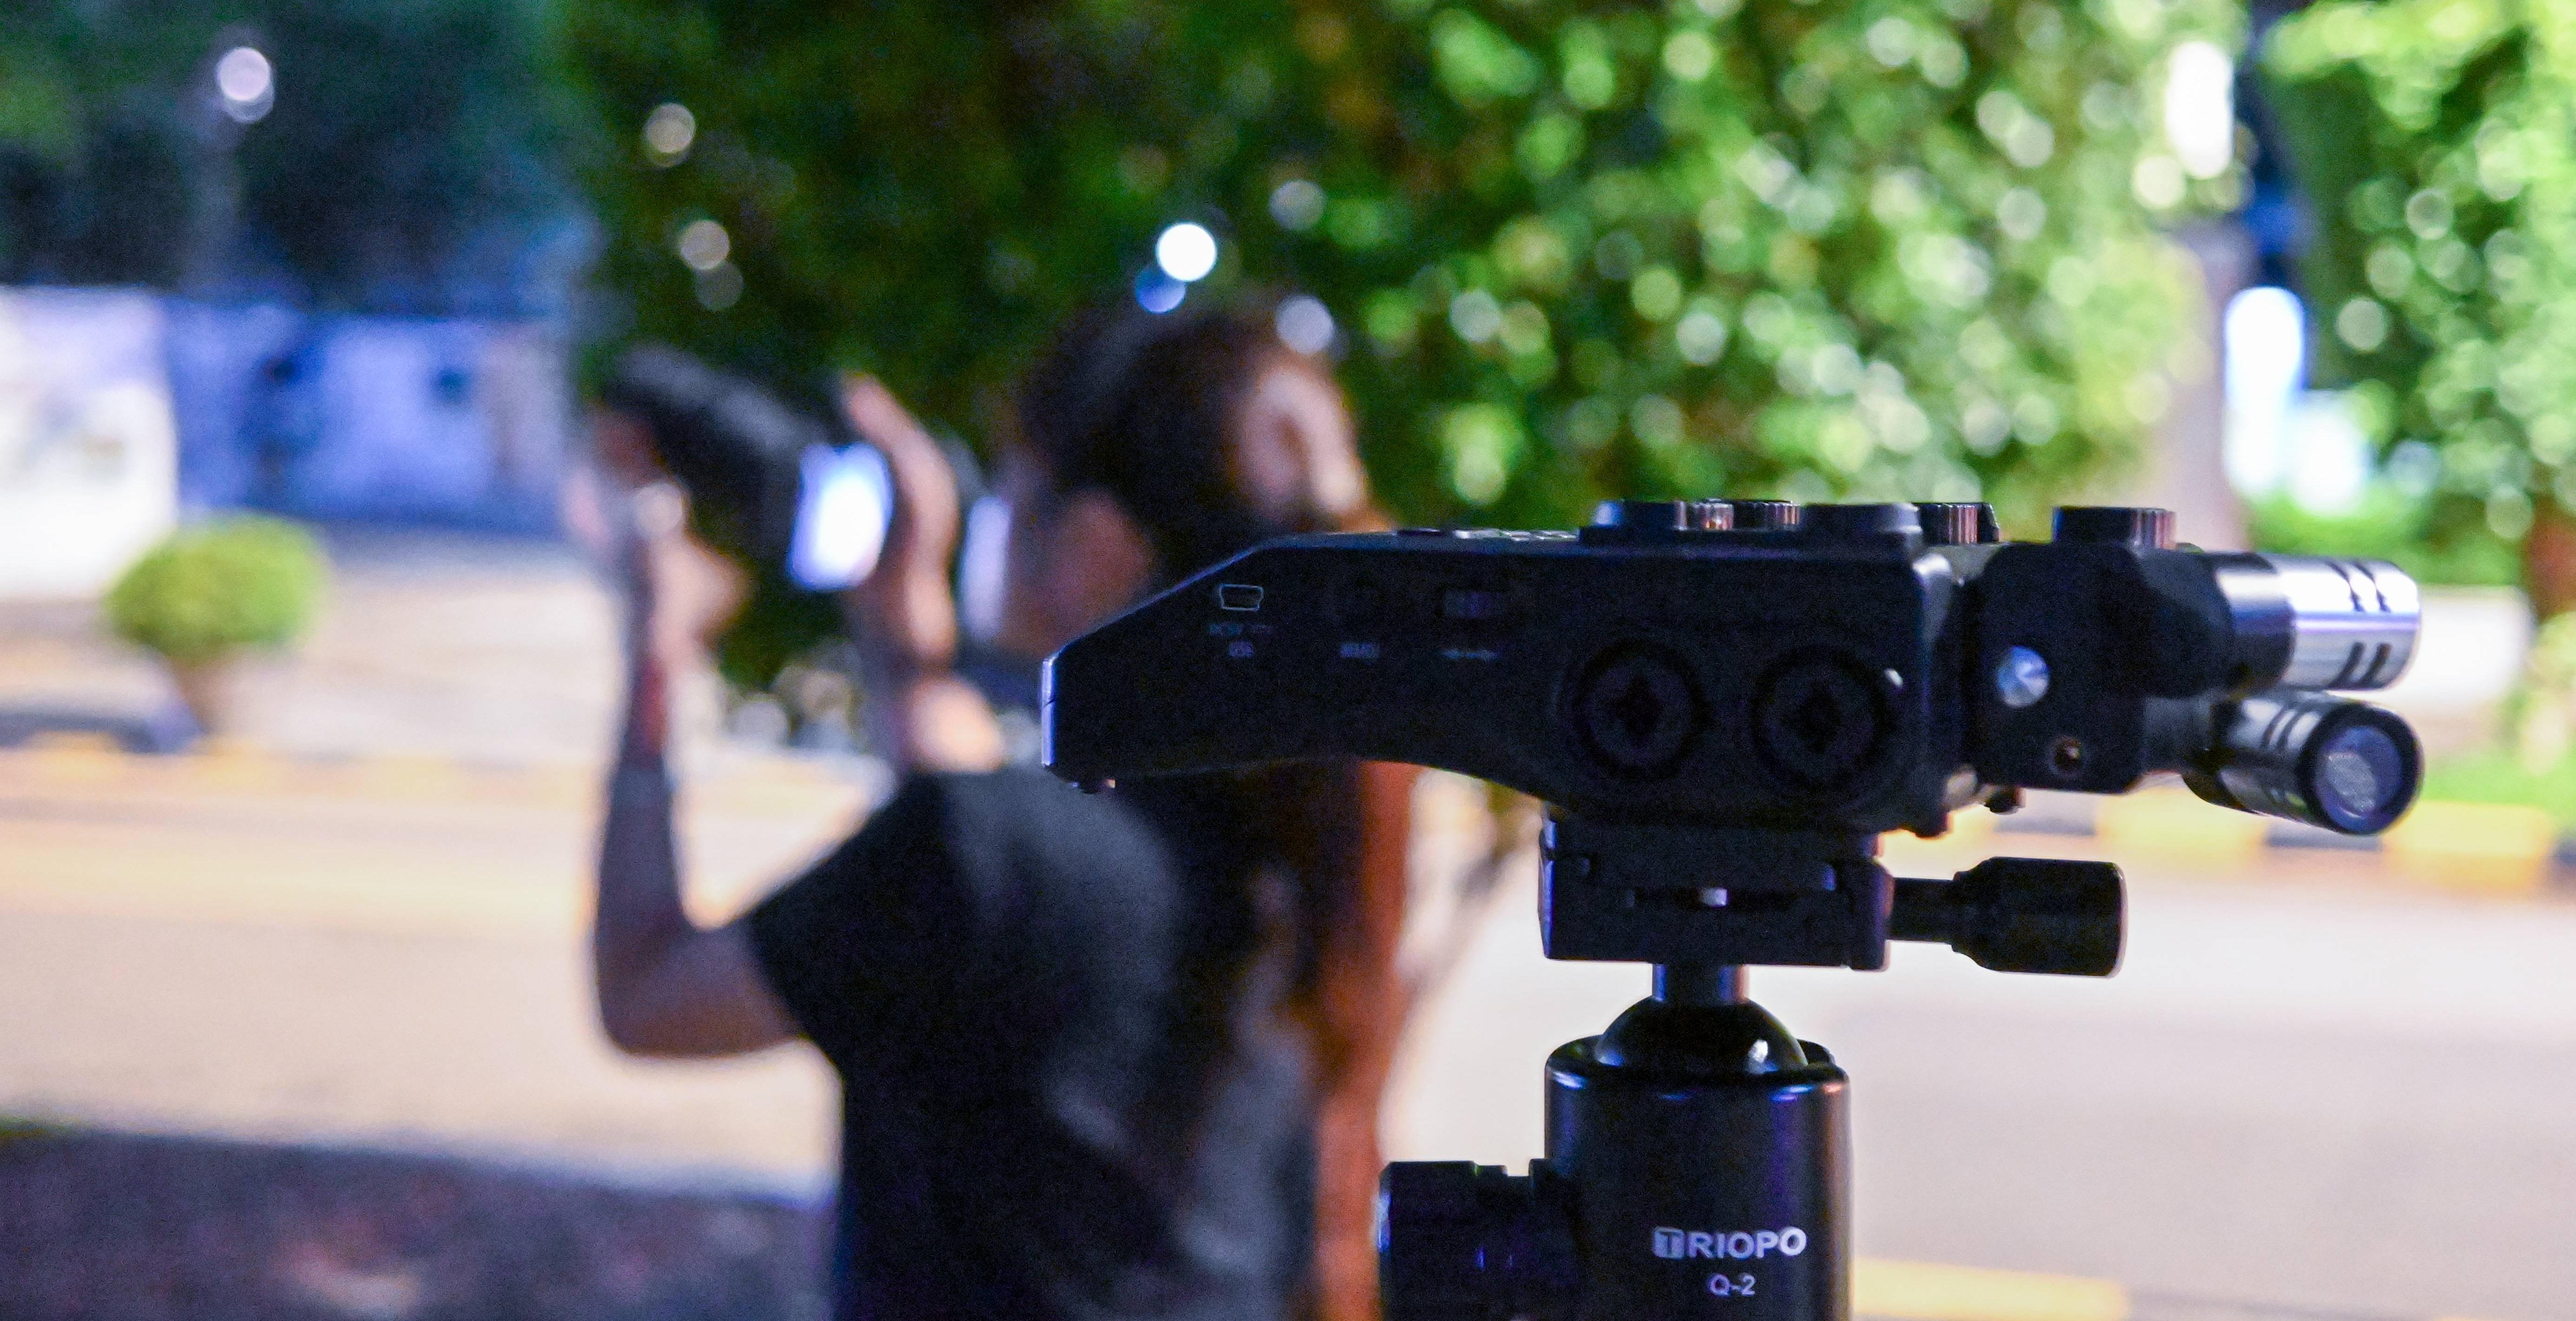
Outside
Use RØDE NT-SF1 Ambisonic Microphone to record spatial audio outside the car, ZOOM H6 recorder to record Stereo audio, and SMARTSENSOR AR844 Decibel Meter to measure the decibel level of the environment. The RØDE NT-SF1 is mounted on the stand at a height of 1.6 m from the ground and also connected to the Mixer(PreMix-6 II) using wires, record the Ambix format and Fuma format at the same time; The ZOOM H6 recorder is mounted on the stand at a height of 1.6 m from the ground. The Decibel Meter is held by Pedestrian at a height of 1.6 m from the ground.
Recording Post-Process
The sound recording use the RØDE NT-SF1 Ambisonic Microphone needs to be processed before it can be used normally. The digital audio workstation REAPER and SoundField by RØDE VST plugin are used for post-processing spatial audio recording. Import the audio file into REAPER and open the SoundField by RØDE plugin. Select the corresponding audio input format based on the recording format. Here, choose the B-format(Ambix) format and set the microphone placement to Upright. Set the audio output format to Stereo, so that it can be monitored through headphones.
Experiment
Data Analysis
Average Analysis
Street types and perspectives affect risk perception.
Average analysis - Identify the overall level of risk perception in various urban streets.
MANOVA Analysis
MANOVA analyzes whether the two perspectives of risk perception affected by changes in street types.
Box: represents the middle 50% of the data
Median: The horizontal line in the middle of the box represents the median of the data.
Whiskers: extends to the range of non abnormal data, typically from Q1-1.5IQR to Q3+1.5IQR (IQR is the interquartile range).
Outliers: Points located outside the whisker, indicating extreme values.
Correlation Analysis
As for the driver: The more you can hear, you are more concentrated, the more risk you can perceive. When you have a sense of control and security, you feel comfortable.
As for the pedestrians: The more you can hear, the safer it is. The more comfortable it is, the more it can maintain driving behavior, and the safer it feels. The perception of risk is related to attention concentration.